Support is greatly appreciated and can be sent here:

 www.patreon.com
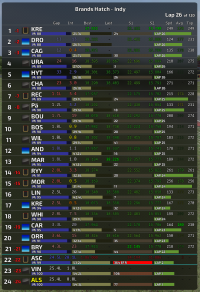
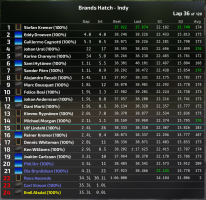
ZenLeaderboard is a fully customizable Timing Tower/Leaderboard/Relative display that provides all the information you might want about your fellow racers. When all of the options are turned on, it will be helpful for streaming or watching AI races on your own, and when only the essentials are displayed it can be a useful substitute for all of the various app you might be using which serve a similar purpose -- ZenLeaderboard aims to do it all in one.
It comes with the following features:
Note about Average Speed display:
Average speeds are displayed in the following way:
- at the start of a new lap there will be no average speed displayed
- once the driver has completed 10% of the lap, their average speed so far will begin to show, but it will be dimmed to indicate that is it not yet being considered in the calculation to find the best Average Speed
- as the driver progresses from 10 to 50% of the lap length, the average speed number will grow in brightness, indicating that it is becoming more relevant.
- the driver's average speed will only be considered a Best candidate after the driver has finished 50% of the lap.
Get more from RossAscends on Patreon
Frontend Web Design, Stable Diffusion, JP-to-ENG Localization
www.patreon.com
ZenLeaderboard is a fully customizable Timing Tower/Leaderboard/Relative display that provides all the information you might want about your fellow racers. When all of the options are turned on, it will be helpful for streaming or watching AI races on your own, and when only the essentials are displayed it can be a useful substitute for all of the various app you might be using which serve a similar purpose -- ZenLeaderboard aims to do it all in one.
It comes with the following features:
- Quick-switch between Global and Relative Modes in the same window. (just right-click anywhere in the app window)
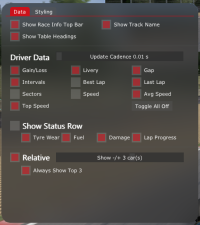
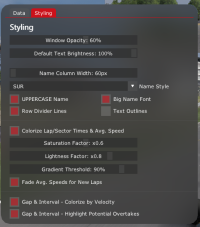
- toggles for nearly every type of driver information and display style
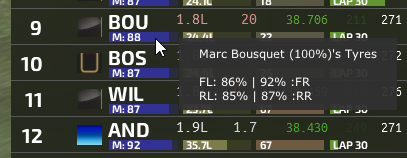
- Driver tyre, fuel, damage, and lap progression status bars
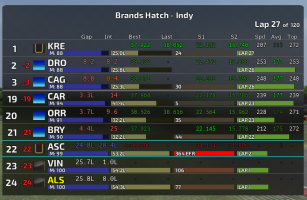
- Best Lap, Last Lap, and Average Speed can be colorized to provide at-a-glance understanding of how the racers are performing relative to one another.
- Gap and Interval can be colorized to show the rate of change between the drivers (quickly getting closer = red; gap is quickly widening = blue)
- Click a driver's position, livery image, or name to spectate that driver (when in Relative Mode, the display respects the switch in focus as well)
- driver names are colored to reflect their race status (pink = in pit, yellow = triggered a yellow flag, blue = lapped by the car in focus)
Note about Average Speed display:
Average speeds are displayed in the following way:
- at the start of a new lap there will be no average speed displayed
- once the driver has completed 10% of the lap, their average speed so far will begin to show, but it will be dimmed to indicate that is it not yet being considered in the calculation to find the best Average Speed
- as the driver progresses from 10 to 50% of the lap length, the average speed number will grow in brightness, indicating that it is becoming more relevant.
- the driver's average speed will only be considered a Best candidate after the driver has finished 50% of the lap.